The Same Boundary, Two Different Stories
See how map frames change a Western boundary dispute’s apparent scale, and learn to read local and regional maps without mistaking either for the whole story.
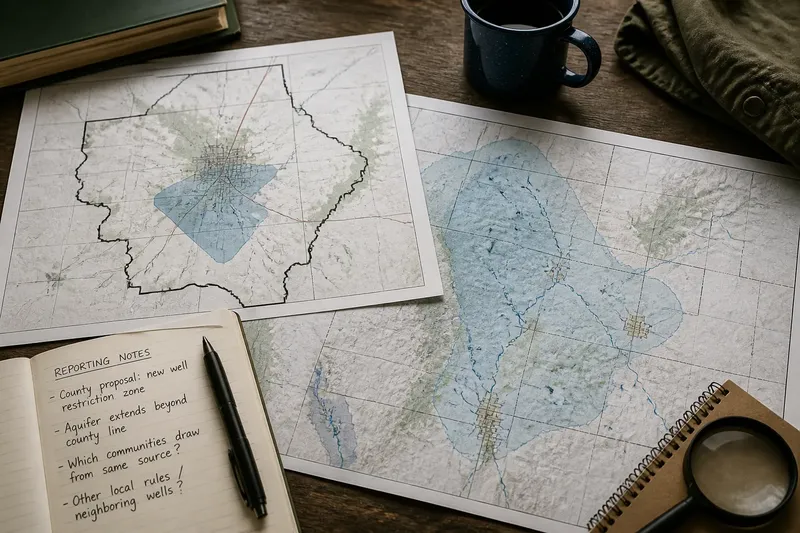
A map that stops at a county line can make a Western water dispute look like a neighborhood quarrel; a map that spans a watershed can make the same conflict look regional. That is the framing power of a boundary: it guides the eye toward some relationships and away from others before a reader reaches the story’s second paragraph.
The problem is not that one map must be dishonest. Each may accurately show a different jurisdiction or physical feature. The trouble starts when the frame is mistaken for the full account, or when a news story lets the map’s edges quietly decide who counts as affected.
What does the first map make visible?
Say a fictional Western county is debating whether to restrict new groundwater wells near a fast-growing town. An article opens with a map of the county, the town, and the proposed restriction zone. The shaded area sits close to town streets, and the county boundary encloses the entire image.
That frame makes the issue legible as a county decision with a nearby public cost. Readers can see which neighborhoods are close to the zone and which local officials are responsible for the proposal. But the county edge also acts like a visual stop sign: a reader may not notice that the aquifer or the people drawing water from it extend beyond the county.
In this version, the story may naturally emphasize residents, local planning, and the county board’s authority. Those are relevant details, not distractions. Still, a map centered on the decision-maker can make the affected geography appear to end where that institution’s jurisdiction ends.
Check whether the map’s frame follows the issue or simply the office handling it.
What changes when the map follows the water?
Now imagine the same article includes a second map. It shows the aquifer’s estimated reach across several counties, along with rivers, wells, and municipal boundaries. The town is still there, but it occupies less of the page; the county line is now one among several overlapping borders.
The story’s apparent scale changes. The proposed restriction remains a county action, yet the water system connects places outside that county. A reader may now ask how the decision interacts with neighboring wells, shared streams, or other local rules. The map does not answer those questions, but it makes them harder to miss.
That wider frame can also distort if treated as a complete account. An aquifer boundary does not automatically tell a reader which communities rely on it, how water moves at a particular site, or which agency has authority over each decision. A regional outline can make connection look simpler than it is.
A larger map adds relationships to investigate; it does not settle them.
How can one hypothetical story change from start to result?
Picture an editor assigning a short report on the fictional county’s proposed well restriction. The first draft uses only the county map and describes a local debate between town residents and county officials. The draft is readable, but it leaves the reader with a narrow question: should this county adopt the rule?
The reporter then checks the proposal’s stated boundary against a regional water map and discovers that the mapped aquifer crosses county lines. Rather than claim that the restriction will affect every place above that outline, the reporter asks which nearby communities draw from the same source and whether the proposal applies beyond the county. The revised story adds a regional map, labels its limits, and distinguishes the county’s legal decision from the wider water geography.
The result is not a verdict for or against the restriction. It is a more precise account: the county is considering a local rule within a water system that does not follow the county line. Readers can see both the immediate decision and the connection that makes its consequences worth asking about.
The editorial improvement comes from changing the question, not from making the map more dramatic.
What should a reader inspect on a regional map?
When two maps tell different-looking stories, pause over the design choices that shape each one:
- Boundary type: Is the edge a county line, watershed divide, aquifer estimate, service area, or proposed policy zone?
- Map extent: Which places fall outside the frame, and could they share the same resource or decision?
- Labels: Are towns, tribal lands, agencies, rivers, or neighboring jurisdictions named clearly enough to locate?
- Legend: Does a shaded area mean an estimated physical feature, a legal restriction, or something else?
- Source and date: Who made the map, what does its caption say it represents, and is it current for the issue being reported?
- Scale and detail: Does the image show enough local detail to identify affected places, or only the broad regional pattern?
These checks are not a demand for every article to print several maps. They help a reader notice when a single frame is doing more interpretive work than the accompanying explanation acknowledges.
Why can both maps be accurate and still feel incomplete?
A map is a selection, not a miniature version of the whole region. It can represent a government boundary faithfully while leaving out a physical system, or show a physical system while omitting the rules and communities that shape decisions within it.
In the fictional water dispute, the county map answers, “Where is the proposed restriction?” The regional map answers, “What larger water geography might be relevant?” Neither alone answers, “Who will be affected, by what mechanism, and under whose authority?” Those are reporting questions that require explanation beyond the image.
Readers should also notice visual emphasis. A bold outline, strong color, or large label can make one boundary feel decisive even when the caption describes it as approximate or one factor among several. The map’s appearance may communicate certainty that its underlying information does not support.
Read the caption before treating a line as a conclusion.
What questions help connect the frame to the story?
Does the boundary show jurisdiction or geography?
A jurisdictional line identifies who may make or enforce a decision; a physical boundary describes a feature such as a watershed or an estimated aquifer. A story should say which kind it is using, because the two often cross rather than match.
Who disappears beyond the map’s edge?
Look for neighboring towns, rural communities, tribal governments, or downstream places that may be relevant to the issue. Their presence on a map does not prove an effect, but their absence should prompt a question about whether the story has considered them.
What does the map not establish?
A map can show proximity or overlap without proving causation, legal authority, or a particular outcome. Check whether the article explains what evidence would be needed to support those stronger claims.
Would a different frame change the central question?
If a county view asks who should decide locally while a watershed view asks how connected places relate, the difference is editorially meaningful. A strong account can make both questions visible without pretending they are interchangeable.
How should a story use two frames without overclaiming?
A clear report can identify the first map’s purpose, then explain why a second geographic frame matters. It should name the boundary types, place the relevant communities, and state what the maps do not establish. That small amount of orientation helps readers see why a local decision may have regional context without implying that every connected place faces the same consequence.
For a Western regional story, the useful habit is to ask what the map’s edge excludes before accepting the story’s scale. The same boundary can frame a decision as local or connected; the better account shows what each view reveals, what each leaves out, and which unanswered question belongs to the reporting rather than the map.